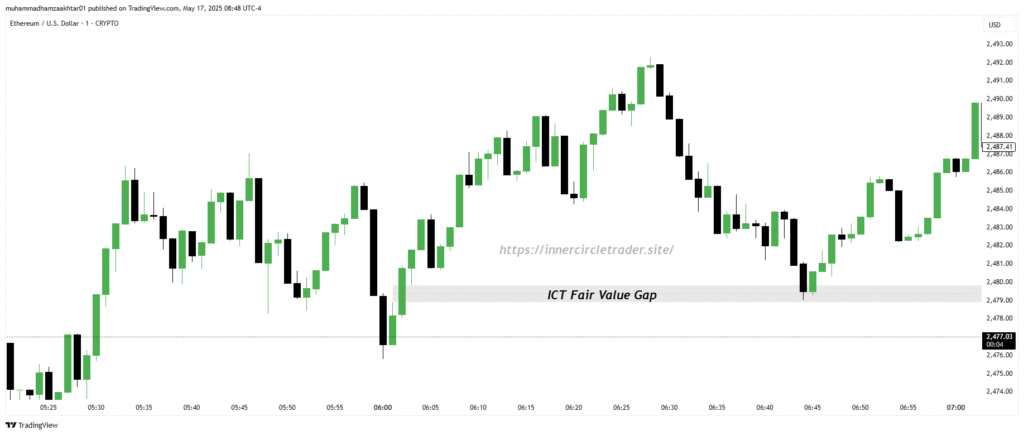
A Fair Value Gap is a price area on a chart where the market moves too quickly, creating an imbalance between buyers and sellers. This rapid movement leaves a gap or empty space between candles that the market often returns to “fill” or “rebalance” later.
In simple terms:
- The market moves up or down very rapidly
- It creates a gap between candle wicks
- Price frequently returns to this gap area in the future
What is a ICT Fair Value Gap in Trading?
A Fair Value Gap is a three candlestick pattern where the body of 2nd candle is not completely filled by the wick of 1st and 3rd candle .FVG is an area on a chart where the market moves too quickly, without giving buyers or sellers enough time to take action.

This usually happens when a lot of buying or selling happens at once, and the price jumps or drops suddenly.
This fast move creates a gap or empty space between candles. This space is called a “Fair Value Gap” because the market skipped over it too fast, and may return later to “fill” or “rebalance” that gap.
What is a Bullish Fair Value Gap?
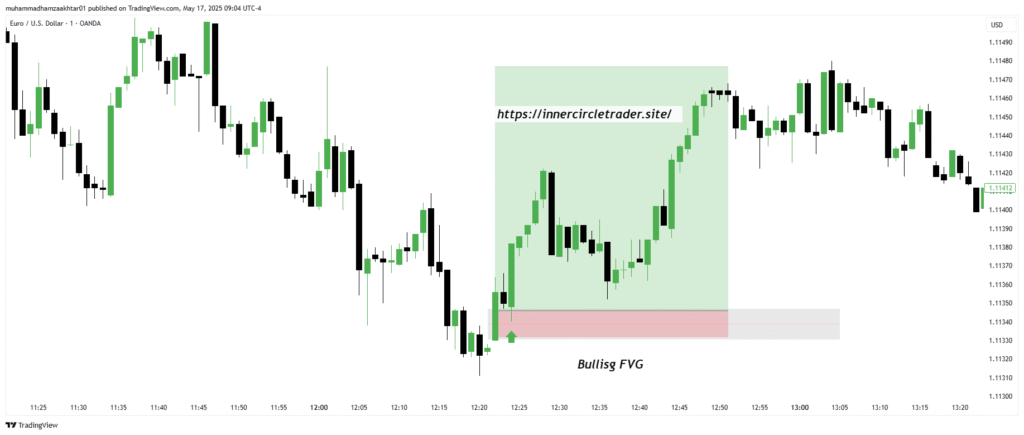
A bullish Fair Value Gap (FVG) represents a significant market imbalance where buyer momentum was so powerful that price rapidly advanced, creating a noticeable void in price action. This pattern reveals exceptional buying pressure and often becomes a key support zone when price revisits the area.

A bullish FVG forms when three consecutive price candles display the following specific arrangement:
- First Candle: This is your baseline candle, establishing the starting price zone.
- Middle Candle: This is a substantial bullish (green) candle showing significant upward momentum. The size of this candle is crucial as it demonstrates the strength of buyers forcefully pushing prices higher with conviction.
- Third Candle: This candle opens and remains above the first candle’s highest point. Critically, the lowest price of this third candle must be positioned higher than the highest price reached by the first candle.
This gap represents a zone where no actual trading occurred because buyers were so aggressive that price “jumped” over this region without normal price discovery. The market moved so decisively upward that sellers had no opportunity to participate in this price range.
When price eventually retraces to a bullish FVG area Institutional traders who missed the initial move up may view this as an opportunity to enter at a better price.
What is a Bearish Fair Value Gap?
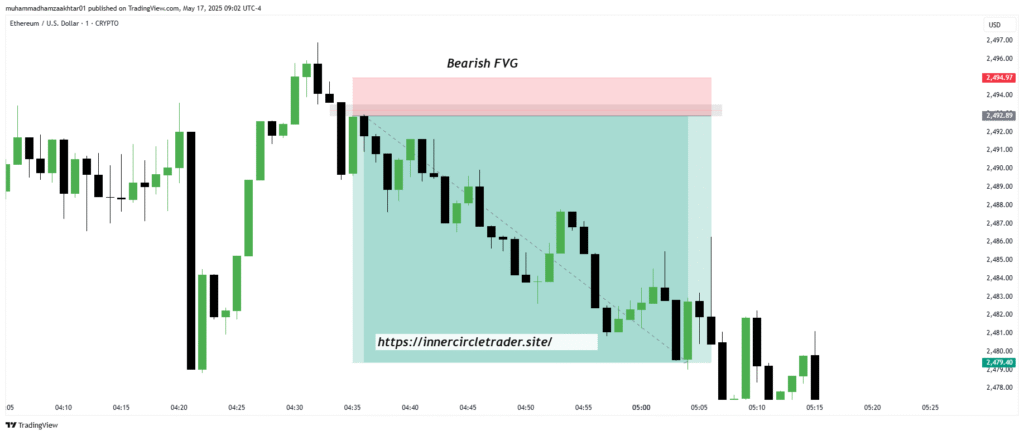
A bearish Fair Value Gap (FVG) represents a powerful market imbalance where selling pressure was so intense that price plummeted rapidly, creating a distinctive gap or void in price action. This pattern reveals exceptional bearish momentum and frequently becomes a key resistance zone when price revisits the area.

A bearish FVG forms when three consecutive price candles display the following precise characteristics:
- First Candle: This establishes the initial price reference point before the bearish move begins.
- Middle Candle: This is a substantial bearish (red) candle demonstrating significant downward momentum. The size of this candle is critical as it shows the conviction of sellers aggressively driving prices lower with force.
- Third Candle: This candle opens and remains below the first candle’s lowest point. Importantly, the highest price of this third candle must be positioned lower than the lowest price reached by the first candle.
The core of the bearish Fair Value Gap is the untested price region between:
- The lowest price of the first candle
- The highest price of the third candle
When price eventually rallies back to a bearish FVG area, it typically attracts new selling interest. This phenomenon occurs because institutional traders who missed the initial move down may see this as an opportunity to enter short positions at a more favorable price
How Do Fair Value Gaps Work?
A Fair Value Gap happens when price is delivered quickly in one direction — either strongly up or down. This fast move creates an imbalance in the market, and the price doesn’t get a chance to trade fairly in that area.
This gap is not just a random event. It’s usually caused by a flaw or glitch in the way price is delivered, known as the Price Delivery Algorithm or Interbank Price Delivery Algorithm (IPDA). This algorithm is used by banks and large institutions to deliver price across different markets.
When smart money (like banks and institutions) suddenly place large orders, it causes the price to move quickly in one direction. This fast movement doesn’t allow enough time for both buyers and sellers to match their orders. As a result, a gap is left behind on the chart — this is the Fair Value Gap.
Once this gap forms, it acts like a magnet. The price is often pulled back into this area later to “rebalance” the market. This means that the algorithm starts adjusting price to return and fill the gap before continuing in the original direction.
You’ll usually notice that before this gap forms, there were no similar gaps on the left side of the chart. That’s because this gap was created by a sudden injection of large orders, and now the algorithm is working to correct or “fill” the skipped price zone.
How to Find a Fair Value Gap?
Finding a Fair Value Gap (FVG) becomes easier once you understand what to look for on the chart. ICT traders use FVGs as part of their high-probability setups, especially when combined with liquidity sweeps and market structure shifts (MSS).
The Fair Value Gap is based on a simple three-candle formation. You need to find a pattern where the middle candle is large (either bullish or bearish), and the wicks of the first and third candle do not fully cover the body of the middle candle.
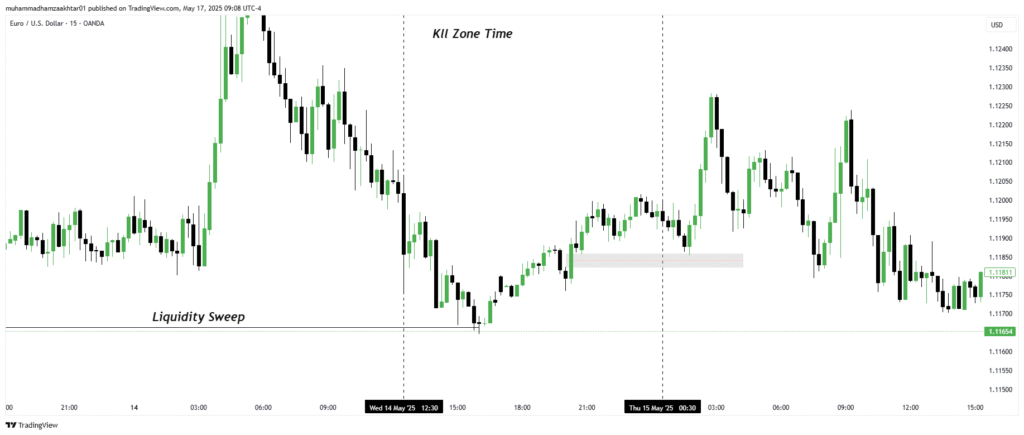
Look for Fair Value Gaps during ICT Kill Zone times — these are specific hours of the day when the market becomes highly volatile, and smart money injects large orders to move price with strong momentum
- London Kill Zone (approx. 2 AM to 5 AM New York time)
- New York Kill Zone (approx. 7 AM to 10 AM New York time)
Because during these times, big institutions and banks are active, and the moves they create are more likely to be meaningful and tradeable. When a Fair Value Gap forms during these Kill Zones, it carries higher probability because it reflects real smart money activity.
How to Draw a Fair Value Gap
Once you spot a Fair Value Gap, you can draw it on your chart using a rectangle or box.
- For bullish FVG, draw a box from the high of the first candle to the low of the third candle.
- For bearish FVG, draw a box from the low of the first candle to the high of the third candle.
This box is your “gap zone.” You wait for price to return to this area and look for trade entries.
Fair Value Gap Trading Strategy For Forex and Indicies
To trade Fair Value Gaps effectively, follow the key principles taught by ICT in his 2022 Mentorship. These steps help you stay aligned with smart money and increase your trade accuracy.

Mark Liquidity Zones
At the start of any ICT Kill Zone (London or New York session), identify key liquidity levels on the 15-minute chart.Look for equal highs or equal lows — these are areas where retail traders usually place their stop-loss orders.These levels are important because smart money targets them to create liquidity for their entries.
Wait for a Liquidity Sweep
Be patient and wait for the algorithm to sweep liquidity. This means price should break above a previous high (buy-side liquidity) or below a previous low (sell-side liquidity).The sweep tells you that the market has collected stop-losses and is likely preparing for a reversal or strong move in the opposite direction.
Confirm Market Structure Shift
After the liquidity sweep, shift to the 3-minute or 5-minute chart and look for a Market Structure Shift (MSS). This happens when the trend breaks — for example, price starts making higher highs and higher lows (for a bullish reversal), or lower highs and lower lows (for a bearish reversal). The MSS confirms that the market direction has changed.
Find the Fair Value Gap
Now drop down to the 1-minute timeframe and look for a valid Fair Value Gap (FVG).
The FVG should appear right after the MSS — it’s the result of the strong price move caused by the shift. This FVG is your entry zone.
Set Your Stop Loss Properly
For buy trades, place your stop-loss just below the first candle of the FVG.For sell trades, place your stop-loss just above the first candle of the FVG. This helps you manage risk while staying protected from normal price fluctuations.
Choose a Logical Take Profit Target
Set your take-profit level at the next liquidity pool or use the ICT Optimal Trade Entry (OTE) tool.Target areas where other traders have their stop losses or where price previously reversed.These are likely zones where the algorithm will push price next.